In changing our reports to point from an older database server to a newer one, we needed a way to tell which reports we’d migrated so far and which ones still had data connections to the old server. Keeping a list of reports would be the easiest way to do this, but why do that when you can write a query to track it for you!
I came across this post that provides the outline of what I was looking for:
https://community.powerbi.com/t5/Report-Server/Get-all-connection-string-for-reports-from-power-bi-report/td-p/920392
It provided the following M-code, which uses the Power BI API to fetch a list of all reports on the server and all the datasource details (it doesn’t fetch the contents of the actual M-code behind the data sources – that would be pretty amazing). Nonetheless, pretty neat on its own (you need to replace “<YOUR URL>” in a couple of spots):
let

    Source = OData.Feed("https://<YOUR URL>/pbireports/api/v2.0/PowerBIReports", null, [Implementation="2.0"]),

    #"Expanded DataSources" = Table.ExpandTableColumn(Source, "DataSources", {"Id", "ModifiedBy", "ModifiedDate", "ConnectionString", "DataModelDataSource"}, {"DataSources.Id", "DataSources.ModifiedBy", "DataSources.ModifiedDate", "DataSources.ConnectionString", "DataSources.DataModelDataSource"}),

    #"Expanded DataSources.DataModelDataSource" = Table.ExpandRecordColumn(#"Expanded DataSources", "DataSources.DataModelDataSource", {"Type", "Kind", "AuthType", "Username", "ModelConnectionName"}, {"DataSources.DataModelDataSource.Type", "DataSources.DataModelDataSource.Kind", "DataSources.DataModelDataSource.AuthType", "DataSources.DataModelDataSource.Username", "DataSources.DataModelDataSource.ModelConnectionName"}),

    #"Added Conditional Column" = Table.AddColumn(#"Expanded DataSources.DataModelDataSource", "DS.Connection_String", each if [DataSources.ConnectionString] = null then "No Data Source" else [DataSources.ConnectionString]),

    #"Removed Columns" = Table.RemoveColumns(#"Added Conditional Column",{"CacheRefreshPlans", "AccessToken", "Roles", "ContentType", "Content", "ParentFolder", "Properties", "Comments", "AlertSubscriptions", "AllowedActions", "Policies", "DependentItems","Id", "ParentFolderId", "DataSources.Id", "DataSources.DataModelDataSource.ModelConnectionName"}),

    #"Renamed Columns" = Table.RenameColumns(#"Removed Columns",{{"DataSources.ConnectionString", "DS.ConnectionString"}, {"DataSources.DataModelDataSource.Type", "DS.Type"}, {"DataSources.DataModelDataSource.Kind", "DS.Kind"}, {"DataSources.DataModelDataSource.AuthType", "DS.AuthType"}, {"DataSources.DataModelDataSource.Username", "DS.Username"}, {"DataSources.ModifiedBy", "DS.ModifiedBy"}, {"DataSources.ModifiedDate", "DS.ModifiedDate"}, {"Name", "Report"}, {"Path", "Report Path"}}),

    #"Add Report URL" = Table.AddColumn(#"Renamed Columns", "Report URL", each "https://<YOUR URL>/PBIReports/powerbi" & [Report Path] & "?rs:embed=true")

in

    #"Add Report URL"
This was a good framework, but I wanted to add a few things and combine multiple different servers together (My example shows a dev, qa, and prod server being combined, but they could be any number of servers or even both Power BI Server and SSRS if you wanted):

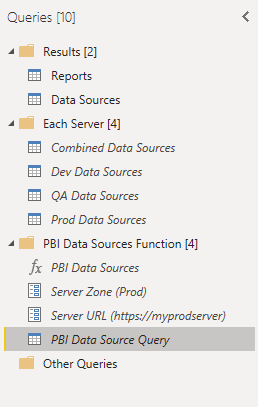
The M-code shown earlier became the highlighted item above – I converted it to a function (“PBI Data Sources” at the top of the “PBI Data Sources Function” group) that accepted both a “Server URL” (replacing the “<YOUR URL>” portion in the initial query) and a “Server Zone” allowing you to name the server in the results. Once you have the function, we move up to the last three objects in “Each Server”, which each call the function with different parameters (for each of my server zones), and then combine them into a single dataset (“Combined Data Sources”). Finally, the results are split into a list of Reports and a list of Data Sources that you can pull into your Power BI model.
Once of the issues I ran into was that I didn’t have access to all the reports on my server – those broke my dataset with the following message:

Interestingly, it wasn’t a “Permission Denied” error, but a 500 server error. I got around it by adding some code to drop any rows where I received an error by using the “try otherwise” error handing in M, something I’d never used before:
= Table.SelectRows(#"Sorted Rows", each ((try [DataSources]{0}[Id] otherwise null) <> null))This code checks to see if it can view the very first value within the “DataSources” field, and if it can’t, it returns null and then the row gets filtered. This isn’t the most elegant way to do this – it drops any reports I don’t have access too, rather than calling them out, but it got the job done and allowed my dataset to move forward without errors.
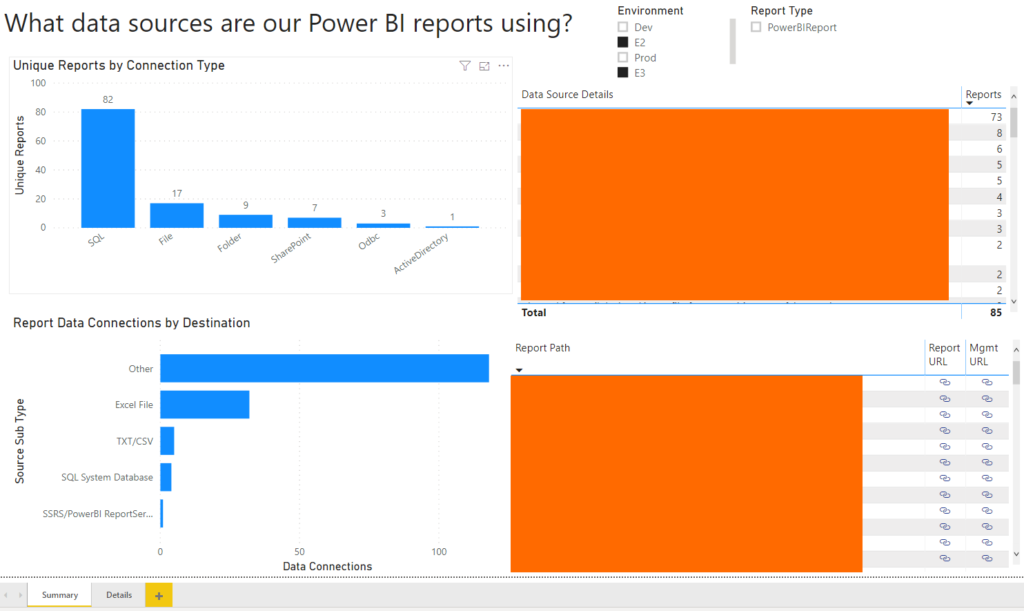
Once the data is in the model, you can use some simple visualizations to see what types of connections you have, where you’re connecting, and what user those connections are set up to use (so you can see if every one of your connections is using the correct proxy users).

I hope this helps you get a handle on all the data sources you’re using, and make sure that everything is using the correct settings. I’ve included the empty PBIT file at the end of this post for anybody that wants to connect to their data and see what it looks like (when you open the file, it prompts you for two variables – you can put whatever you want there, but it’s because I’ve left the source query in the file).
If you do end up using this to create something, please let me know what as I’d love to see it in action!


